Hedging Strategies for GBP: What’s been effective in the past year?

As the GBP/USD spot rate currently sits at the midpoint of its 12-month range, many corporate treasurers are searching for the best way to hedge their currency exposures. This article analyzes the performance of various hedging strategies over the last year. To facilitate an accurate comparison, we’ve adopted a standardized approach: the corporate treasurer needs to buy 1,000,000 USD every two months starting on 1 November 2022, resulting in a total of six hedges. The results show that significant outperformance has been possible when moving away from traditional hedges of forward, participating forwards, and forward extras.
ANALYSIS
Before we start, let’s look at the history of the underlying market. The market is trading at 1.2523 after experiencing a 1.1779/1.3142 range over the period in question. The key drivers of the market have been monetary policy/yields and economic data as both regions battle inflation, energy prices, and geopolitical uncertainties.
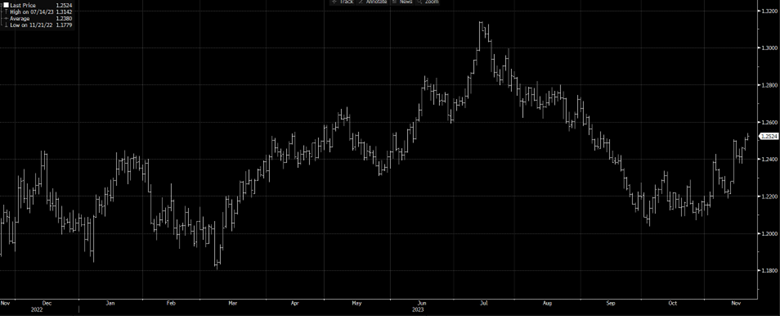
Source: Bloomberg | GBP/USD spot market over the past year.
The implied 3-month volatility is currently trading at 7.2% after experiencing a high of 12.1% and a low of 7.1% this year. We examine this because it can offer comparative advantages to different strategies through enhanced hedging rates. This current level is low and below the 5-year average of 9.15%.
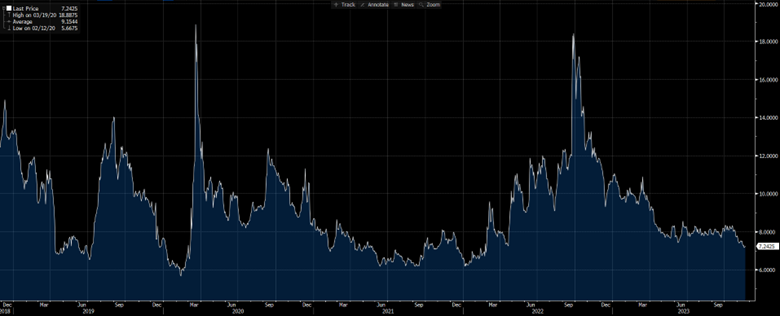
Source: Bloomberg | GBP/USD 3-month implied (traded) volatility over the past 5 years.
Strategy 1: Participating Forward
The Participating Forward gives the USD buyer / GBP seller guaranteed protection at a rate worse than the equivalent forward but, with this, gains the opportunity to outperform by benefitting from fifty percent of a favorable spot move (higher). The strategy is long volatility; therefore, lower implied volatility improves the protection level.
Outcomes
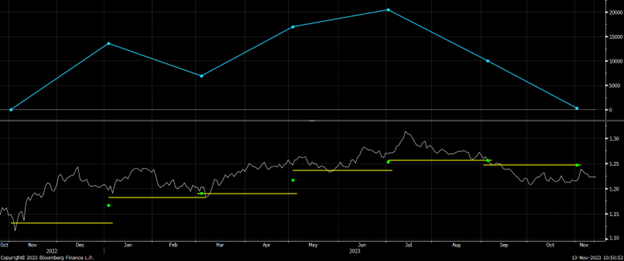
Three out of the six outperformed when comparing how this strategy has performed against the equivalent forward. This strategy would have been better than the equivalent forward hedges by USD 289.63, or on average, less than a basis point for our USD 1,000,000 hedges. This is usually a solid hedging strategy, and the current lower volatility level improves the hedge rate, but the consolidation and spot moving lower from July stopped it from performing better.
Source: Bloomberg
The chart above shows the profit or loss of hedging with a GBP/USD Participating Forward compared to equivalent forwards. The lower section of the chart shows the spot market with the protection rates in yellow and effective exchange rates in green.
Strategy 2: Forward Extra
The Forward Extra gives the USD buyer / GBP seller protection at a rate worse than the equivalent forward with the ability to benefit in a move up a predefined barrier level. If the barrier trades, then the lower protection rate is locked in. In this example, each 2-month hedge had strikes 1.5% below the spot at interception.
Outcomes
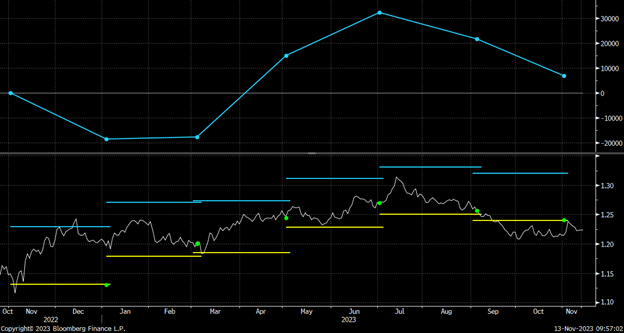
When comparing how this strategy has performed against the equivalent forward, two out of the six outperformed. Using this strategy would have performed better than the equivalent forward hedges by USD 6,856.98, or on average 0.11%, for our USD 1,000,000 hedges. This strategy would have excelled in markets that ground higher, which was not the case, and would have worked for USD sellers over the last six months.
Source: Bloomberg
The above chart shows the profit or loss of hedging with a GBP/USD Forward Extra compared to an equivalent forward. The lower section of the chart shows the spot market with the strike in yellow, the barriers in blue, and effective exchange rates in green.
Strategy 3: Ratio Forward
The Ratio Forward is the reverse of the Participating Forward. It gives the USD buyer / GBP seller an improved rate compared to the equivalent forward, but if the spot moves in a favorable direction, they will be required to trade in double the amount. The strategy is short volatility; therefore, higher implied volatility improves the rate.
Outcomes
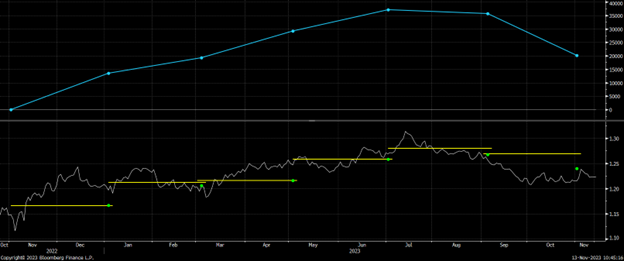
Four out of the six outperformed when comparing how this strategy has performed against the equivalent forward. Using this strategy would have been better than the equivalent forward hedges by USD 20,205.76 or, on average, 0.34% for our USD 1,000,000 hedges. This comparison uses a forward for the higher (leveraged) amount. This structure is short volatility, and improvements are always limited and not a significant magnitude at this current level of implied volatility after it has fallen.
Source: Bloomberg
The chart above shows the profit or loss of hedging with a GBP/USD Ratio Forward compared to equivalent forwards. The lower section of the chart shows the spot market with the strike in yellow and effective exchange rates in green.
Strategy 4: Range Forward
The Range Forward gives the USD buyer / GBP seller protection at a rate better than the equivalent forward if the range holds. If spot trades outside the range, the protection rate moves to a level worse than the equivalent forward. The strategy is short volatility; therefore, higher implied volatility improves protection. This can be a smart way to play short volatility as it is only locally short. In this example, each 2-month hedge had ranges +/-5% from the spot at interception.
Outcomes
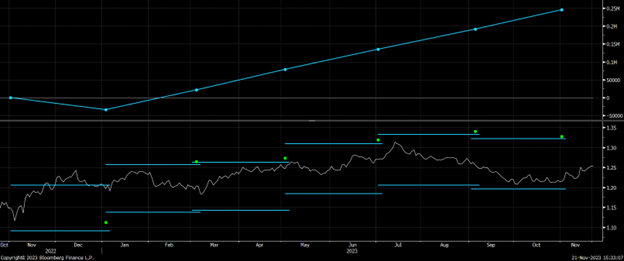
When comparing how this strategy has performed against the equivalent forward, we can see that five out of the six outperformed. Using this strategy would have been better than the equivalent forward hedges by USD 245,522.92, or on average 4.09%, for our USD 1,000,000 hedges. We like to use these when the market transitions from a high-volatility environment to a range-bound one. A high implied volatility and tight range can enable great risk-to-reward, but slightly wider ranges in this case have been working for GBP/USD.
Source: Bloomberg
The chart above shows the profit or loss of hedging with a GBP/USD Range Forward compared to an equivalent forward. The lower section of the chart shows the spot market with the ranges in blue and effective exchange rates in green.
Strategy 5: Knockout Forward
The Knockout Forward gives the USD buyer / GBP seller protection at a rate better than the equivalent forward; however, this strategy knocks out if the market moves against them (spot lower). The strategy is short volatility; lower implied volatility improves the strike level. It should be noted this strategy is not a hedge but is often used to achieve an enhanced blended exchange rate. In this example, each 2-month hedge had barriers 3% below the spot at interception.
Outcomes
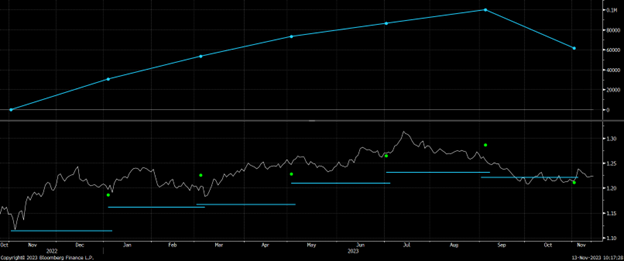
When comparing how this strategy has performed against the equivalent forward, five out of the six outperformed. Using this strategy would have been better than the equivalent forward hedges by USD 61,749.49, or on average 1.03%, for our USD 1,000,000 hedges.
Source: Bloomberg
The chart above shows the profit or loss of hedging with a GBP/USD Knockout Forward compared to an equivalent forward. The lower section of the chart shows the spot market with the strike in yellow, the barriers in blue, and effective exchange rates in green.
CONCLUSION
The results of this exercise are interesting to observe, but it is important to note that all results are in the past, and there is no guarantee of future performance. Back-testing results can also vary according to the dates and parameters used. What is important is that hedging is periodically analyzed and adjusted where necessary.
Out of the four strategies, number 4 (range forward) can only be described as a standout.
- Backtesting results show it outperforms forward by an average of 4%.
- Gives clear protection levels for any large move.
- Chance to outperform and this can be tailored.
- GBP/USD is towards the middle of the 1-year range, so levels are easier to pick.
GPS Capital Markets provides corporate foreign exchange services to help companies manage foreign currency risk and execute foreign currency transactions.
Clients across the world trust GPS to minimize their FX risk and grow their international business by combining competitive exchange rates and our award-winning FXpert® platform with a host of tailored international financial solutions, including Intercompany Netting, Hedge Accounting, Balance Sheet Hedging, cross border payments, Data Analytics, and Cash Flow Hedging. For more information, book a call with one of our expert advisors.
This document is for information purposes only and does not constitute any recommendation or solicitation to any person to enter into any transaction or adopt any trading strategy, nor does it constitute any prediction of likely future movements in exchange rates or prices or any representation that any such future movements will not exceed those shown on any illustration. All exchange rates and figures appearing are for illustrative purposes only. You are advised to make your own independent judgment with respect to any matter contained herein.


