FX Risk and Currency Markets In a US Election Year
Once every four years, the world witnesses a highly anticipated event: the US presidential elections, yet the influence of these elections on currency markets and associated FX risk begins well before November 5th.
This holds especially true in 2024, which will see both current US President Joe Biden and Donald Trump, the probable Republican party nominee, each seeking a second term, and where both candidate’s foreign and economic policies are well known.
Historically, the US presidential election has been a catalyst for heightened volatility in FX markets. While we know past performance is no guarantee of future outcomes, there is much to be gained by observing the impact of the past three presidential elections – 2020 Biden vs. Trump, 2016 Trump vs. Clinton, and 2012 Obama vs. Romney.
In this article, we will analyze the impacts and risks of each candidate by currency and recommend the best ways to hedge exposures that are open.
IMPORTANT DATES
First, let’s begin by looking at a timeline of important dates extending into the coming year that will likely have currency market-moving effects.
- January – June: State primaries and caucuses select candidates and award delegates
- July 15-18: Republican National Convention
- August 19-22: Democratic National Convention
- November 5: Election Day
- January 20: Inauguration Day
Each date indicates a period of uncertainty— a potential driver of FX market volatility. By staying informed and adapting your approach to FX risk as the election year progresses, you can effectively hedge your exposures and protect against FX risk.
THE CANDIDATES
If current polling persists, the 2024 election will be the result of a Biden-Trump match. However, there is much speculation about the outcome of former President Donald Trump’s legal scrutiny and its effects on his candidacy. The front-runner to the Republican party has a series of court dates from January through to May, and their outcomes have the potential to change the landscape of the election significantly.
If the present election probabilities hold true, with Joe Biden facing off against Donald Trump as the most probable scenario, then our focus will be on global trade negotiations and the impact a possible Trump win would have on tariffs.
FX RISK DUE TO CURRENCY MOVEMENTS ON ELECTION YEARS
USD
In our analysis, we employed seasonal charts to evaluate the performance of the USD during election years. Since the election takes place on the Tuesday following the first Monday in November, dates can vary. Our observations encompassed daily movement between October 28th and November 25th of each respective year.
The chart of the Bloomberg US dollar index illustrates that during this period, the USD exhibited a 3.8% increase in 2016 when Trump was elected, a 2.2% decrease in 2020 when Biden won the election, and a relatively stable movement in 2012 when Obama was reelected. This represents a 6% swing in the dollar’s value between the two presidential candidates.
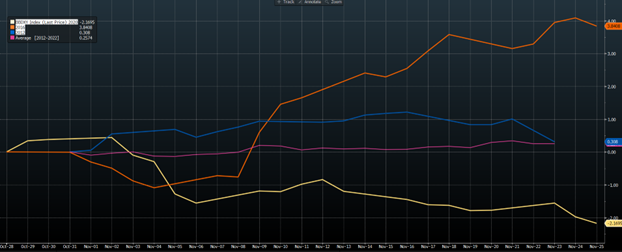
Source Bloomberg: Bloomberg US dollar index percentage movement, election years 2020 (yellow), 2016 (orange), and 2012 (blue).
MXN
The Mexican peso could be the currency that falls the most in the event of a Trump victory—in the month when he was elected, the USD appreciated 8.1% against the peso, whereas it depreciated 6.2% following Biden’s victory. Considering that Mexico is the United States’ largest trade partner, with a total volume of $736 billion in total trade transacted in 2022, the election will unquestionably present many opportunities and challenges for this currency.
RELATED ARTICLE: Could You Be Managing Your EM FX Risk Better?
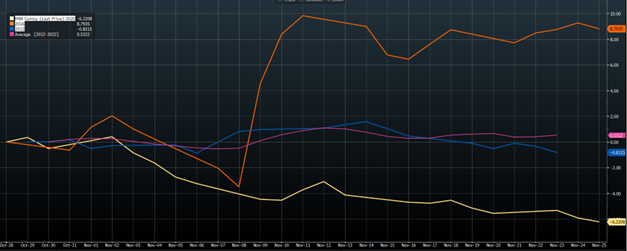
Source Bloomberg: USD/MXN percentage movement, election years 2020 (yellow), 2016 (orange) and 2012 (blue).
CNY
A Trump victory could have a similarly negative impact on the CNY. During the month of Trump’s election, the USD appreciated 2.4% against the yuan. While in contrast, the more sympathetic Biden saw the dollar depreciate 2.5% in 2020. It’s worth noting that China is the United States’ third largest trade partner, with $715 billion in total trade transacted in 2022.
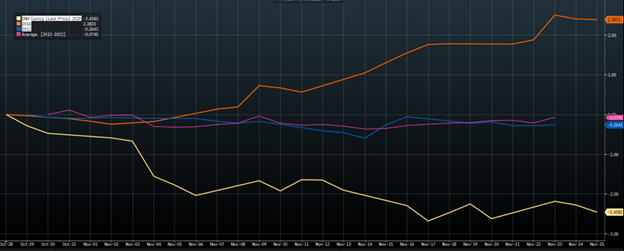
Source Bloomberg: USD/CNH percentage movement, election years 2020 (yellow), 2016 (orange) and 2012 (blue).
JPY
The Japanese yen could equally feel the pinch, surpassing the broader dollar index under a Trump win. During the month of his election, the dollar appreciated 8.1% against the yen, whereas in 2020 Biden saw the dollar appreciated 0.1% 2020. Japan is the fourth largest trade partner of the United States, with $239 billion in total trade transacted in 2022.
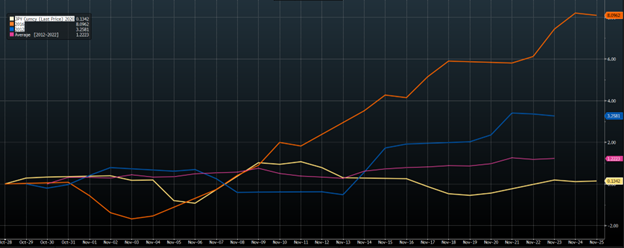
Source Bloomberg: USD/JPY percentage movement, election years 2020 (yellow), 2016 (orange) and 2012 (blue).
AUD
The Australian dollar is a higher-risk currency that has the potential to exhibit greater movement compared to other major currencies, as indicated by its elevated implied volatility. In the month when Trump was elected, the Australian dollar experienced a 2.1% depreciation against the US dollar, whereas when Biden secured the victory, the Australian dollar appreciated by 4.6%.
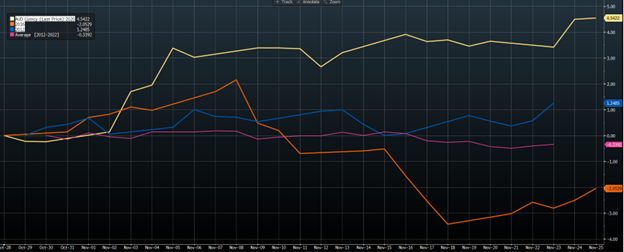
Source Bloomberg: AUD/USD percentage movement, election years 2020 (yellow), 2016 (orange) and 2012 (blue). Note that the rate is inverted compared to the other pairs.
MONETARY POLICY
The market is currently factoring in the likelihood of some aggressive interest rate cuts from the Federal Reserve. So, it’s worthwhile to examine the behavior of the cash rate in election years.
The chart below illustrates the Fed Funds rate with each election year represented by a different color. There doesn’t appear to be a clear pattern or consistent trend, as each election year corresponds to vastly differing points in the economic cycle. This may serve to validate the independence of the Federal Reserve.
2020: The Republicans lost power to the Democrats; rates were cut early in the year post-COVID to 0.25%.
2016: The Democrats lost power to the Republicans; rates remained at 0.5% throughout the year before increasing a further 0.25% after the election.
2012: The Democrats remained in control, with rates remaining at 0.25%.
2008: The Republicans lost power to the Democrats; rates moved lower in the backdrop of the Global Financial Crisis.
2004: The Republicans remained in control with rates moving higher in the later part of the year.
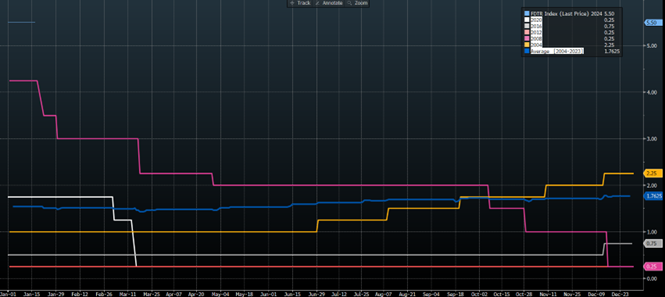
Source Bloomberg: Fed Funds Upper Target across the last five elections.
CHANGES IN THE OPTIONS MARKETS
The magnitude of risks, as well as the potential changes in the FX markets, can be observed as higher implied volatility trades associated with various vanilla options occur. It might take some experience to quantify these accurately this far ahead of the election, and options market makers are already marking their books accordingly.
For a more in-depth look into the intricacies of how the implied volatility market is traded, read our article: “50 Years of Black-Scholes: Nobel Victory, Options Revolution.”
Although we previously discussed the additional volatility expected at various key dates throughout this election cycle, market makers will assign weight to key decisions such as the November 5/6 decision. This is a common practice, and market makers prefer to own options that contain key data releases and effectively mark their books higher. For example, prices that include the monthly US non-farm payrolls are generally an extra half day of volatility higher. On Election Day, volatility tends to trade at an additional level equivalent to 9 days of volatility, with even more for currency pairs like MXN.
The chart below demonstrates that the overnight volatility traded much higher for various currency pairs. For example, the USD/MXN jumped from about 15% to 55%, and USD/CNY jumped from around 6% to 17%.
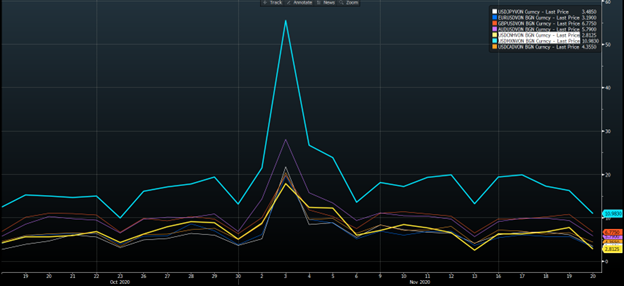
Source Bloomberg: Overnight implied volatility spiking in all currencies over the 2020 election.
When this same chart is reformatted, it becomes evident that the USD/JPY could exhibit the largest relative change, surging from about 3.5% to about 22%.
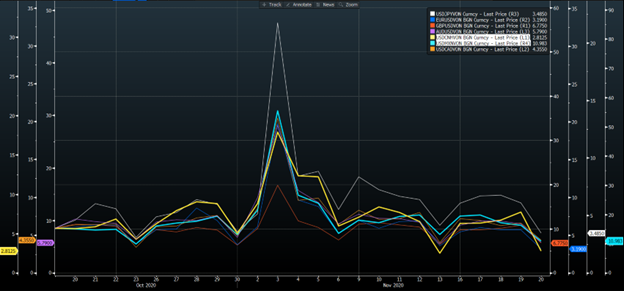
Source Bloomberg: Overnight implied volatility spiking in all currencies over the 2020 election. The independent axis on this chart allows us to see the largest relative move was USD/JPY followed by USD/MXN.
Sharp increases in volatility are also evident when significant milestone dates include the election result. The chart depicted below illustrates the 1-month implied volatility leading into and after the 2020 vote. Across all pairs, volatility increased when the expiry contained the election result (between the two lines) and retracted once the event had passed. It is then possible to solve for the same-day weighting as previously discussed.
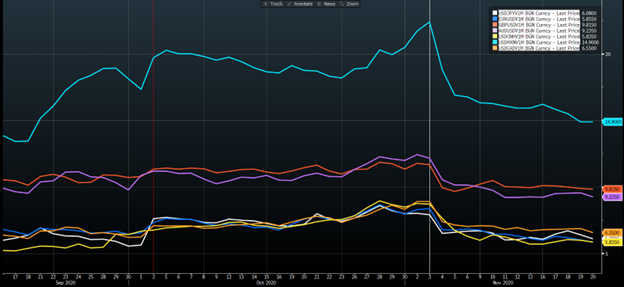
Source Bloomberg: 1-month implied volatility moved higher in all currencies when the 2020 election was included.
Applying the same chart with the independent axis, we can see again that the most affected 1-month implied volatility changes occurred in USD/CNH, USD/MXN, and USD/JPY.
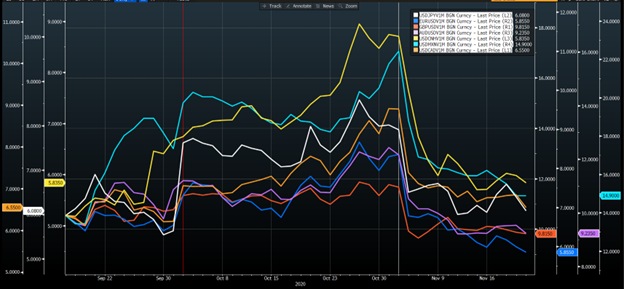
Source Bloomberg: 1-month implied volatility moved higher in all currencies when the 2020 election was included. Using the independent axis on the charts allows us to see that the largest relative movement was in USD/CNY and USD/MXN.
Tips for Corporations Managing FX Exposures During an Election Year
Based on our analysis, here are some recommendations for managing currency-related risks and strategies effectively:
- Take time to assess the currencies to which you are exposed and formulate a strategy to mitigate unwanted currency risk, particularly any USD pair, but especially in MXN, CNY, and JPY. A GPS complimentary currency exposure evaluation can help you kick-start that process.
- If you have strategies such as vanilla options or participating forwards, consider increasing the time to expiry to leverage the potential benefit arising from increased volatility.
- For short volatility strategies, such as range forwards, consider shortening the expiry times ahead of key market events.
- Revisit your exposures and cover these at regular intervals. For example, hedging only out to the calendar year 2024 in January could leave your business with little protection if not revisited ahead of the election late in the year.
The US presidential election year of 2024 promises to be nothing short of unpredictable. While history provides valuable insights into potential volatility, a proactive approach to managing FX risk by continuing to monitor political development and hedging exposures will help your company emerge victorious.


